Reports
Dashboard
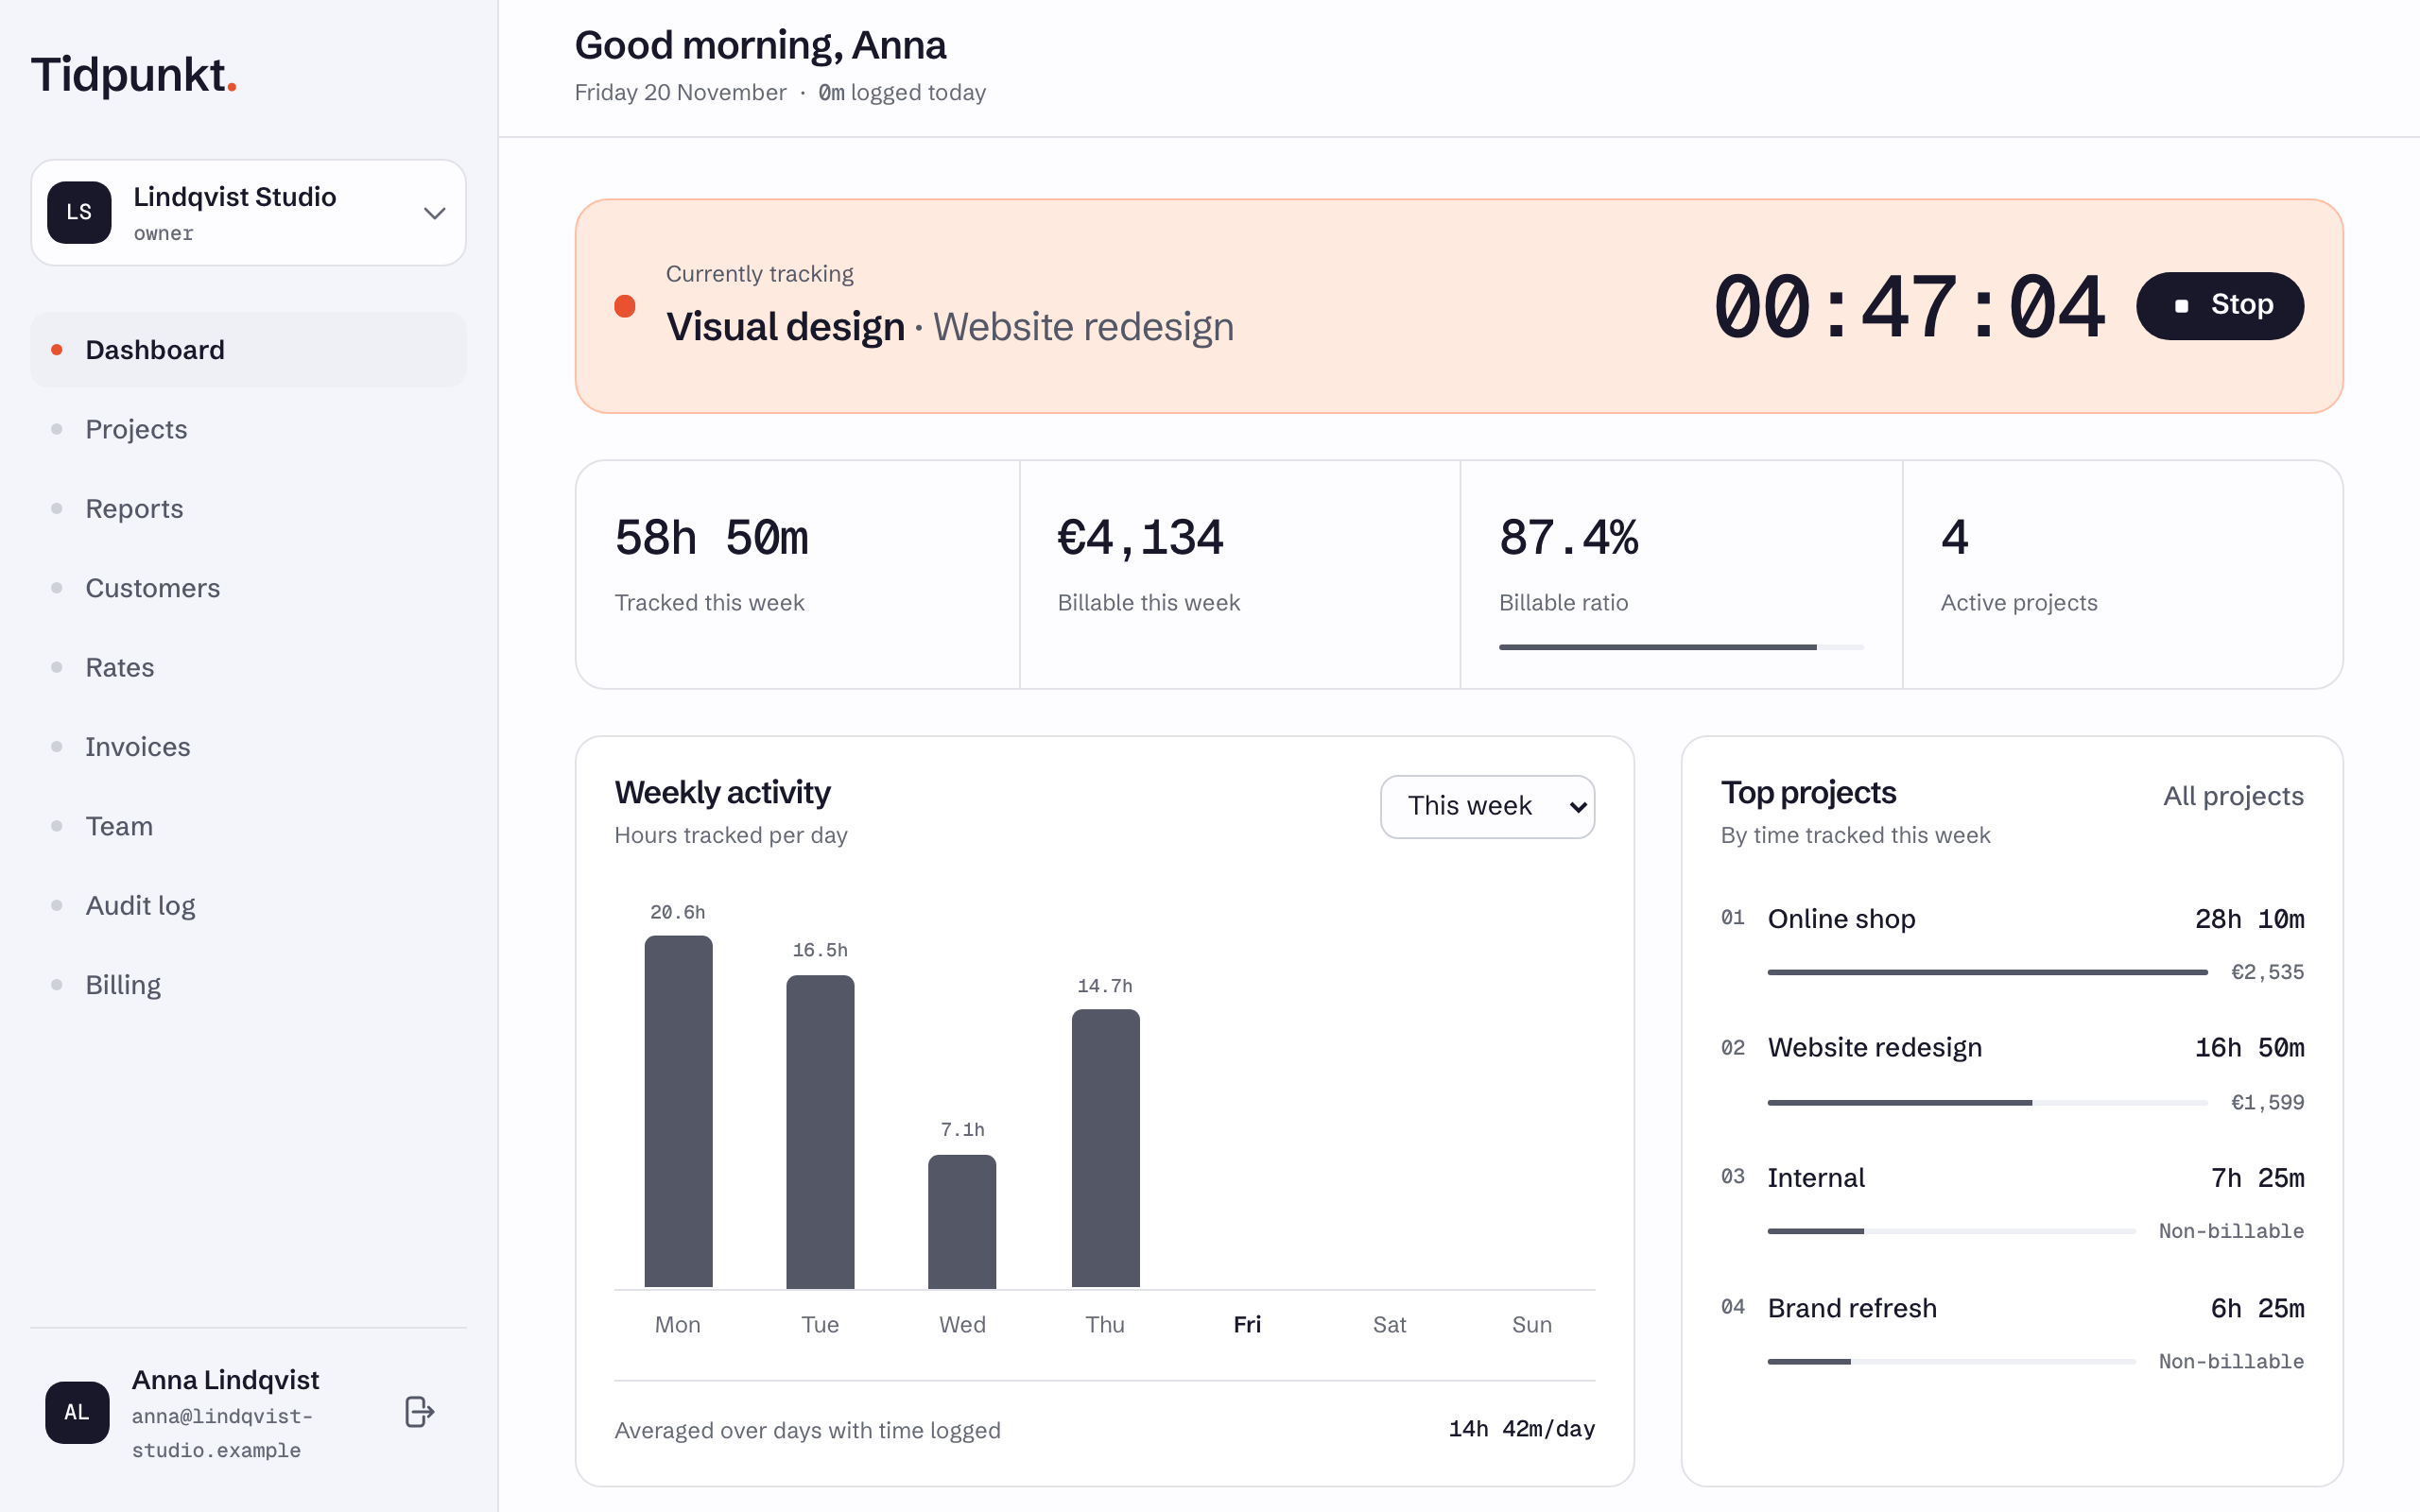
The dashboard is the first page after you sign in and shows this week's activity across the workspace.
Apart from the Activity log-map, the figures cover every member's time, and members see them too. Timers still running are not counted until they stop, and weeks start on Monday. For a filtered view, use Reports.
Running timer
The band at the top shows Currently tracking with the task, project, elapsed time and a Stop button. If nothing is running it shows Nothing tracking and a Start a task link.
The band reads from the list of recent entries on the page you are viewing, so it can show another member's timer. Stop only stops your own. See Use the timer.
This week
| Reading | What it shows |
|---|---|
| Tracked this week | All time tracked since Monday. |
| Billable this week | Amounts per currency, including fixed prices marked billed this week. |
| Billable ratio | The share of this week's time on billable tasks. |
| Active projects | The number of projects in the workspace. |
Billable this week and Billable ratio need a Freelancer, Standard, Professional or Business plan. Other plans see an upgrade link in their place.
Weekly activity
A bar for each weekday, Monday to Sunday, with hours tracked and an average over the days that have time logged. Switch between This week, Last week and This month. In This month, each bar adds up every occurrence of that weekday in the month so far.
Top projects
Up to eight projects, ranked by time tracked this week. On plans with rates, each shows its billable amount or Non-billable. All projects opens the projects list.
Activity log-map
A grid of your own tracked time per day over the last year. It shows only your time.
Recent time entries
The latest entries across the workspace, ten to a page, with Task, Project, Date, Duration and Status. Status is Running, Billable or Internal. Entries older than your plan's history limit are hidden.